


Line Graph 考試時應要注意的地方(七)|IELTS 英文寫作攻略秘笈
發佈時間:14:00 2025-05-25 HKT

雅思試寫作卷一
( IELTS Writing Task 1 ) Line Graph
我上次開始和大家解釋和示範應首先從圖表中找出最主要的特點和趨勢,然後如何組織全篇答案文章的段落,包括使用連接詞或連接片語和如何 paraphrase(改述或意譯)題目的字眼把全篇文章結構變得流暢和一致。
為方便大家向大家作解釋和示範,我再用上篇的線圖(見下)。
圖一
The graph below gives information about tourist arrivals in four different cities. Summarise the information by selecting and reporting the main features, and make comparisons where relevant. Write at least 150 words.
Tourist arrivals per annum in four cities : A, B, C, and D
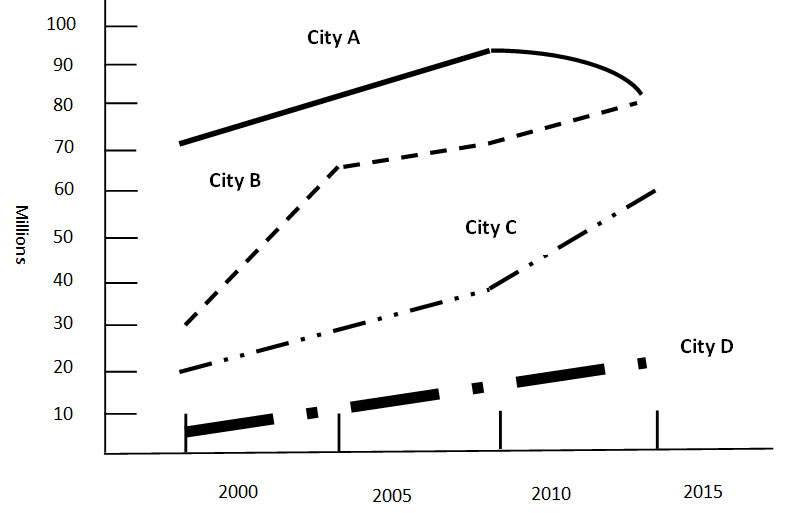
應考或短文寫作卷一(Writing Task 1)卷一的,首先要找出圖表的主要和明顯的數字和趨勢,然後思考用至少三個段落把觀察得的和主要數字和趨勢用文字報告,例如最高和最低、最大和最小和最快和最慢的,並要抽選一些數據或趨勢進行比較。
至於這個線圖,我會用三段來完成作答。
我會用第一段寫overview,但考生必須謹記:絕不能搬字過紙重複問題原文,是要用自己的文字來寫,例如如上一篇文章提及要懂得 paraphrase(改述或意譯)概述題目。除此之外,考生還懂得用同義詞 (synonyms) 來修改問題的原文,然後才扼要地道出圖表的精華:
The graph shows the number of tourists visiting in four cities (A, B, C and D) over the period between 2000 and 2015. Overall, the number of tourists vacationing in all these four cities had been on the rise during this 15-year period, except for City A which saw its number starting to fall steadily after 2010. (57 words)
大家應該注意到在上面的第一段,用了 show 字來取代題目的 give 字,和用了 visiting 和 vacationing 字來代替題目的 arrivals。此外,我用了 overall 這個副詞來為這幅線圖作一個綜合描述。
如果不想用 show 字,可以用 present 和 depict。如果不想用 overall 字,可以用 in general 和 on the whole。
在第二段,考生便要點出此線圖裡出現的主要細節和揀選其中一、兩條走勢或一、兩個城市的數據作比較。在這個關於四個城市的旅客人數的線圖中,第一個明顯特色是,城市 A 接待遊客人數在這十五年期間一直較其他三個城市多,但自 2010 年開始,數字最高峰的九千萬持續下跌至 2015 年約八千萬。
In each of the 15 years between 2000 and 2015, the number of travellers in City A continuously out stripped those in the other three cities, but since 2010, the number was steadily sliding from the peak of 90 million to nearly 80 million in 2015. (45 words)
以上的一句其實也為此線圖裡的四條線作出一個概括比較。
大家同時也應該留意到另一個特點,2000 年至 2005 年間,到訪 B 市的遊客人數增長速度最快,但從 2010 年開始,C 市的旅客人次在四個城市當中增長步伐最快,並超越 B 市。但即使如此,以絕對數字來計,城市B始終高過城市C。而它的數字仍不斷上升,到了 2015 年接近八千萬,幾乎與城市 A 看齊。若要英文來表達,考生可以這樣寫:
One the other hand, the number of tourists visiting City B rose the fastest between 2000 and 2005, but around 2010, that of City C began to grow faster than all other cities, over taking that of City B. But even so, in terms of absolute numbers, City B consistently out performs City C. In addition, the number of tourists visiting City B continued to climb to reach nearly 80 million in 2015, almost the same as that of City A. (79 words)
而另一個可以點出的特別趨勢是,城市 D 接待旅客數量長期遠遠低過他三個城市。因此,以英文來表達:
Also, compared to other three cities, City D continued to receive the fewest visitors over this 15-year period, with around 5 million in 2000 and ending at roughly 20 million in 2015. (32 words)
最後,考生用最後一段來為此圖作一個簡短總結,例如:
As the graph illustrates, City A led the other three in terms of visitor arrivals, while City D constantly had the lowest numbers through out the entire period. (27 words)
我將整篇作答文章張貼在下面:
The graph shows the number of tourists visiting four cities (A, B, C and D) over the period between 2000 and 2015. Overall, the number of tourists vacationing in all these four cities had been on the rise during this 15-year period, except for City A, which saw its number starting to fall steadily after 2010.
In each of the 15 years between 2000 and 2015, the number of travellers in City A continuously outstripped those in the other three cities, but since 2010, the number was steadily sliding from the peak of 90 million to nearly 80 million in 2015.
On the other hand, the number of tourists visiting City B rose the fastest between 2000 and 2005, but around 2010, that of City C began to grow faster than all other cities, overtaking that of City B. But even so, in terms of absolute numbers, City B consistently outperforms City C. In addition, the number of tourists visiting City B continued to climb to reach nearly 80 million in 2015, almost the same as that of City A. Also, compared to the other three cities, City D continued to receive the fewest visitors over this 15-year period, with around 5 million in 2000 and ending at roughly 20 million in 2015.
As the graph illustrates, City A led the other three in terms of visitor arrivals, while City D constantly had the lowest numbers throughout the entire period.

文:Scott Cheng, BA, MBA, LLB and TESOL Certificate,香港大學比較文學系畢業,資深公關從業員,擁有豐富撰寫文稿的專業經驗,現於HKU SPACE兼職教授公關及企業傳訊深造文憑課程高級企業傳訊寫作。
相關文章:
Line Graph 考試時應要注意的地方(六)|IELTS 英文寫作攻略秘笈
Line Graph 考試時應要注意的地方(五)|IELTS 英文寫作攻略秘笈
Line Graph 考試時應要注意的地方(四)|IELTS 英文寫作攻略秘笈
Line Graph 考試時應要注意的地方(三)|IELTS 英文寫作攻略秘笈
Line Graph 考試時應要注意的地方(二)|IELTS 英文寫作攻略秘笈
Line Graph 考試時應要注意的地方(一)|IELTS 英文寫作攻略秘笈
比較句式 「as ... as」用法(二)|IELTS 英文寫作攻略秘笈
關於「as …. as」的比較句型|IELTS 英文寫作攻略秘笈
盡量把 relative pronoun 緊貼要替代的名詞後面|IELTS 英文寫作攻略秘笈
關於 Relative clause 用法和好處|IELTS 英文寫作攻略秘笈
關於 Regarding 用法|IELTS 英文寫作攻略秘笈